claude --resume Used 7% of My 5-Hour Limit (Measured)
Claude Code subscriptions have two limits: a 5-hour window and a weekly limit, both shown as a percentage used. Everyone says resuming a cold session is expensive. I wanted to know how expensive in the units that actually lock you out, so I resumed two idle sessions one at a time and logged both meters and the token counts of every request.
Result: each cold resume took 5–7% of my 5-hour limit and 1% of my weekly limit. Both sessions were Opus 5.5 with 170–210k tokens of context. In both, the first two requests after the resume each wrote the whole conversation to the cache, so the second write was about half of the cost.
Setup
- Plan and model: the $30-a-month Claude plan, Claude Code 2.1.285, Opus 5.5, 1-hour prompt cache.
- Meters: Claude Code passes
rate_limits.five_hour.used_percentageandrate_limits.seven_day.used_percentageto the statusline on every refresh. A statusline script appended each change to a log with a timestamp. - Tokens: every assistant reply in the session's JSONL transcript has a
usagerecord: tokens written to cache (cache_creation_input_tokens), read from cache (cache_read_input_tokens), new input and output. - Baseline: 5-hour 12%, weekly 42% at 15:27 (local time). No other sessions or subagents were running.
- One source of noise: the session I measured from was also open. Its own requests are in the meter readings: about 15% of all usage during the run, roughly 2.5 points of the 5-hour meter. I separate it out below.
Session A: 210k tokens, idle 2.5 days
Last request on November 13. I resumed it at 15:32 and sent one message. When it started a tool call I pressed Esc, and it replied once more.
| Request | Time | Written to cache | Read from cache | Output | 5-hour | Weekly |
|---|---|---|---|---|---|---|
| 1. Reply to my message | 15:32:26 | 209,269 | 0 | 508 | 12% → 16% | 42% → 43% |
| 2. Reply after Esc | 15:35:02 | 190,989 | 24,880 | 70 | 17% → 21% | 43% |
The meter moved 12% → 21%. Leaving out the measuring session, Session A's own requests account for about 7 points of the 5-hour limit, and the weekly limit moved 1 point.
Session B: 183k tokens, idle 12 days
Last request on November 4. My first message was stopped by L2Cache's cold-resume guard ("stopped this message so it doesn't reload 183k tokens"). No request was sent, so that cost nothing. I sent it again at 15:38:12. The model replied and kept working, so requests 2 and 3 came 10 and 16 seconds after the first.
| Request | Time | Written to cache | Read from cache | Output | 5-hour | Weekly |
|---|---|---|---|---|---|---|
| 1 | 15:38:41 | 143,581 | 25,103 | 289 | 21% → 24% | 43% → 44% |
| 2 | 15:38:51 | 146,688 | 24,880 | 161 | 24% → 27% | 44% |
| 3 | 15:38:57 | 1,283 | 171,568 | 284 | 27% → 28% | 44% |
| Next 8 requests | to 15:40:59 | 13,187 total | 1,777,660 total | 3,564 | 28% → 29% | 44% |
The two cache writes took the 5-hour meter from 21% to 27%: about 5 points once the measuring session is left out. The weekly limit moved 1 point. The next eight requests, all reading the warm cache, cost about 2 points together.
The second write
In both sessions the second request read only about 25k tokens from cache, which is the system prompt and tool definitions, and wrote the conversation again. In Session B that happened 10 seconds after the first write, with no Esc involved. The transcript doesn't record why. From the third request on, reads covered the full context as normal.
What one point is worth
Anthropic doesn't publish how the plan meters weight tokens. If I weight them by Opus API price ratios (input 1×, 1-hour cache write 2×, cache read 0.1×, output 5×), every request in the run comes to about 1.92 million input-token equivalents, and the 5-hour meter moved 17 points:
| Source | Input-token equivalents | Share of 5-hour points |
|---|---|---|
| Session A (2 requests) | 805,898 | ~7 |
| Session B (11 requests) | 830,917 | ~7 (5 from the two writes) |
| Measuring session | 281,974 | ~2.5 |
| Total | 1,918,789 | 17 |
- 5-hour limit: about 110k Opus input-token equivalents per point on the $30 plan. A 200k-token Opus session written to cache once is roughly 4 points; written twice, as here, roughly 7.
- Weekly limit: it ticked over twice in the run, at 5-hour readings of 16% and 24%. That's about 8 points of the 5-hour meter per weekly point, or roughly one weekly point per cold resume of this size.
Limits of this test
- Both meters only report whole percents, so any single step is ±1 point. The whole-run figure is the reliable one.
- Two sessions, one plan, one model. Plans with larger limits will move less per resume; the token figures stay the same.
- The price-ratio weighting is my assumption. It fits the meter closely across the run, but it isn't documented.
Measure your own
You need a statusline script that logs the meters, and the session transcript. Neither needs L2Cache.
1. Log the meters. Point statusLine in ~/.claude/settings.json at this script (needs jq):
#!/bin/bash
input=$(cat)
line=$(echo "$input" | jq -r '[.rate_limits.five_hour.used_percentage,
  .rate_limits.seven_day.used_percentage] | @tsv')
if [ "$line" != "$(cat ~/.claude/usage-last 2>/dev/null)" ]; then
  printf '%s\t%s\n' "$(date +%T)" "$line" >> ~/.claude/usage-log.tsv
  printf '%s' "$line" > ~/.claude/usage-last
fi
echo "5h ${line%%$'\t'*}%"
2. Read the transcript. Sessions live in ~/.claude/projects/<project>/<session-id>.jsonl. This prints each request after a UTC timestamp:
import json, sys
seen = set()
for line in open(sys.argv[1]):
    d = json.loads(line)
    m = d.get("message") or {}
    u = m.get("usage") if isinstance(m, dict) else None
    if not u or m.get("id") in seen or d.get("timestamp", "") < sys.argv[2]:
        continue
    seen.add(m["id"])
    print(d["timestamp"][11:19], "write", u.get("cache_creation_input_tokens"),
          "read", u.get("cache_read_input_tokens"), "out", u.get("output_tokens"))
Run it as python3 usage.py <session>.jsonl 2026-11-16T04:30. Then resume a session that has been idle longer than its cache lifetime, send a short message, and compare the two logs. Keep everything else idle while you do it.
How L2Cache helps
L2Cache reads your Claude Code session files and the same statusline data on your Mac, so it can step in at each point where this test spent the limit. Nothing is sent anywhere.
1. See which sessions are cold before you resume
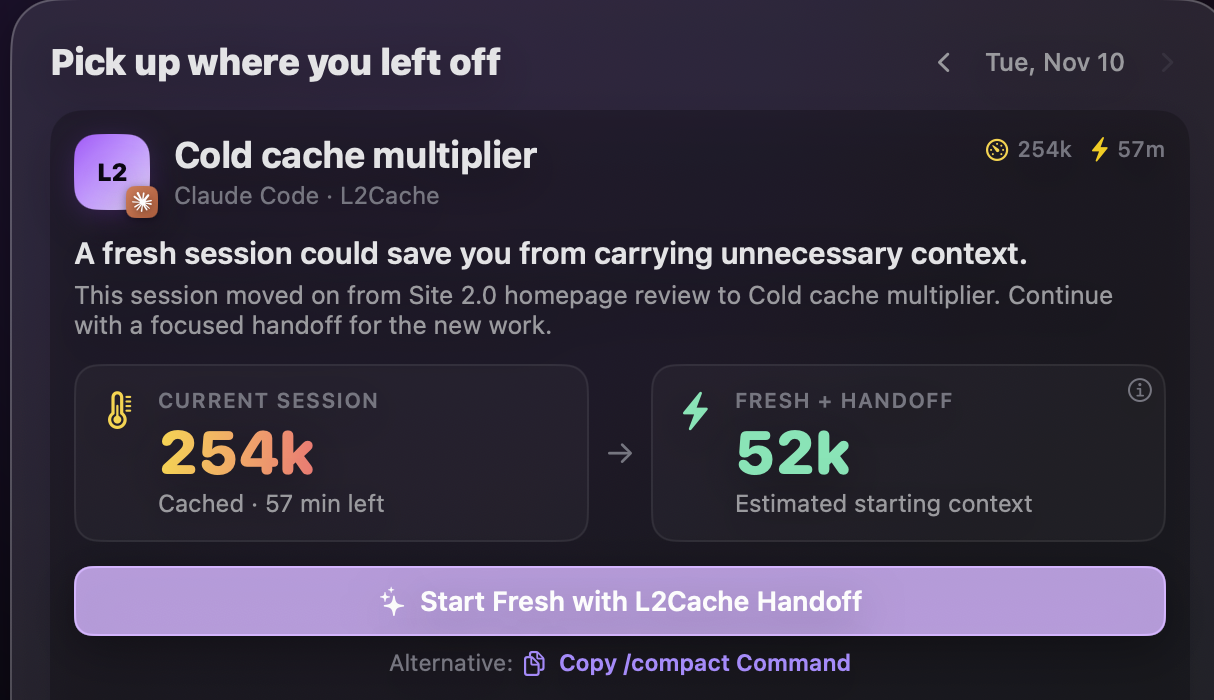
The first step is knowing what a session will cost before you open it. Developer Home in L2Cache has a Pick up where you left off card for each recent session, showing its context size and cache state:
- Warm: "Cache warm: expires in 57 min," with how long it stays cheap to continue.
- Cold: "Cache expired. Your next message reloads all 183k tokens. Starting fresh is cheaper."
Next to it, the card compares the current session with a fresh start plus a handoff, so you can pick before spending anything. In the example below, 254k tokens against an estimated 52k starting context.
2. Get warned at each step after that
- Before the cache goes cold. When a heavy session's cache is 10 minutes from expiring, the menu bar says so while acting is still cheap: compact now, hand off now if the session is too big to keep going, or keep it warm with one short message (about one normal turn, against about 40× on return).
- When you resume a cold session. The terminal says what the next message will cost before you send it:
Cold cache at 14:05 — this session's cache expired 3 h ago.
Your next message reloads 183k tokens (≈ 40× a warm turn).
Cheaper: type /clear — L2Cache starts a fresh session with this session's handoff.
Or just send your message to continue as is.- It stops the first message once. That's what happened to Session B: the message wasn't sent and cost nothing. Press ↑ and Return to send it anyway (you won't be stopped again in that session), or type
/clearand the new session starts with a short handoff (goal, files, what's done, what's next) instead of 183k tokens. - When the cache is rewritten early. If a turn rewrites the cache without going idle, like the second write in both sessions here, the terminal says so at the end of the turn with the tokens re-written. At 200k context or more it says
/compactnow for the same task, or/clearfor a new one; below that, a repeat is cheap and it says no action is needed. - Where your tokens went. The token report in the app groups every cache write by cause (idle beyond the cache lifetime, usage-limit pause, conversation rewritten, everything rewritten and more), so you can see which sessions are costing you the most.
- Your limits as they move. The app shows the live 5-hour and weekly percentages and keeps the same usage log used for this article. Optional macOS notifications fire when the 5-hour window passes 80%, the weekly limit passes 90%, or your weekly pace would run out before the reset.
What I do now
- Small session: just resume it. A 30k-token reload is under a point.
- Large session, same task:
/compactbefore leaving it, while the cache is still warm. - Large session, coming back cold:
/clearand start from a short handoff instead of reloading 200k tokens. Background on why cold reloads cost so much is in Why resuming a cold Claude Code session costs more.
L2Cache shows each session's size, cache state and live plan limits, and stops a cold reload before it happens.
Download L2Cache for Mac